3.2.2 Display Images
The next recommended step is to display the raw images. This will provide you an opportunity to visually inspect all images for artifacts, or other problems. It also allows you to review whether the number of slices and volumes is correct, and that the Import routines properly sorted your image volumes.
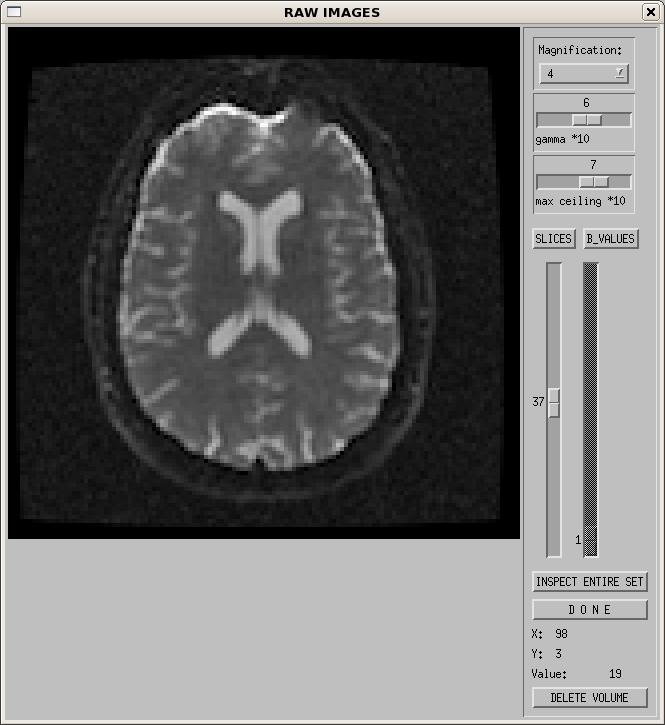
On the top right of the GUI, you should now see that the "display raw images" and "estimate signal SD" buttons are available. Click on "display raw images". You will see a new window pop up (as in the figure below).

The controls on the right hand side function as follows:
- Magnification - controls the size of the displayed image on your screen. Default is 4.
- Gamma - controls the gamma correction. It can be used to adjust the contrast of the images as viewed on your screen.
- Max ceiling - adjusts the maximum intensity value displayed.
- SLICES - this allows you to view all slices of a single brain volume (i.e. a single b0 or DWI volume).
- B_VALUES - this allows you to view a single slice from all brain volumes (i.e. slice #37 for all b0 and DWI volumes).
- If you use the B_VALUES slider to select a particular volume, then click back on SLICES, it will let you view all slices from that new volume.
- INSPECT ENTIRE SET - This function allows you to view either all slices from one volume or one slice from all volumes on a single screen. More details on this in the next section.
- DONE - click this when you are done viewing the images. It is always advisable to use the "Done" buttons, and not to close the widgets with the 'x' at the top right of the window. Using the 'x' to close can cause problems with the software.
- Labels 'X', 'Y', and 'Value' - If you move your mouse cursor over the image, it will display the coordinate and the intensity value at that voxel location.
- DELETE VOLUME - This allows the user to delete extremely bad brain volumes which may be affected by artifacts such as spike noise, or within-volume motion. Use this function with caution! The number of images used in your experiment can affect the value of your tensor derived metrics1,2. If you find yourself removing more than a few volumes from your data, reconsider if the data is worth keeping, and if you want to include it in a group analysis, as it may affect your statistics. More details on this function are provided in section 3.2.2.2.
References
- Farrell JA, Landman BA, Jones CK, Smith SA, Prince JL, van Zijl PC, Mori S (2007) Effects of signal-to-noise ratio on the accuracy and reproducibility of diffusion tensor imaging-derived fractional anisotropy, mean diffusivity, and principal eigenvector measurements at 1.5 T. J Magn Reson Imaging. 26(3):756-67. Abstract
- Tannazi, F., et al, (2011) Bias in Diffusion Tensor-Derived Quantities Depend on The Number of DWIs Composing The DT-MRI Dataset, 19th Annual ISMRM, Montreal, Quebec, Canada.
