3.2.10 ROI Utilities
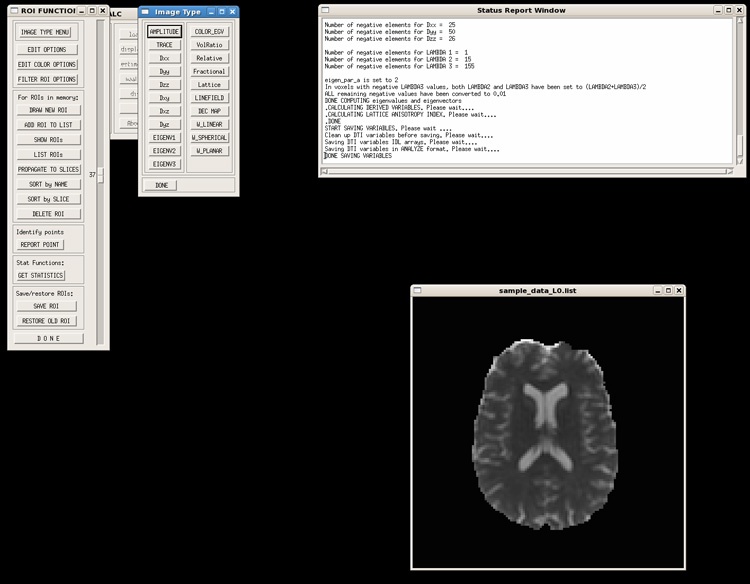
The ROI utilities area allows the user to view all of the derived metric maps, as well as the tensor elements. It also contains ROI drawing and statistics output. When you first click on ROI utilities, you will see a window open on the right hand of your screen, and 2 menus open on the left hand of your screen. The right window will likely be black. Use the slider on the ROI FUNCTION menu to scroll through the image slices. See figure below:

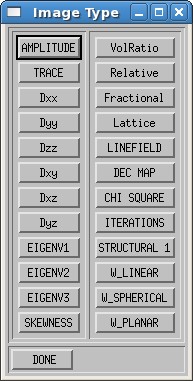
The default image displayed in the image window is the Amplitude image. The other available maps are as shown in the Image Type menu:

- AMPLITUDE: a calculated reference (S0) image, calculated from the intercept of the tensor fitting.
- TRACE: the trace of the diffusion tensor. Mean diffusivity (MD) = 1/3(TRACE)
- Dxx, Dyy, Dzz: diagonal tensor elements
- Dxy, Dxz, Dyz: off-diagonal tensor elements
- EIGENV1, EIGENV2, EIGENV3: the eigenvalues
- SKEWNESS: the degree of oblateness or prolateness of the diffusion ellipsoid in each voxel based on the skewness of the eigenvalues
- ((Mean–Median)/Mean)
- COLOR_EGV: a color coded eigenvalue image
- VolRatio: volume ratio
- Relative: relative anisotropy
- Fractional: fractional anisotropy
- Lattice: lattice index
- LINEFIELD: vector field of the first eigenvector
- DEC MAP: directionally encoded color maps
- CHI SQUARE: a voxel-wise map of a measure of the goodness of fit
- ITERATIONS: a map of the number of iterations needed for the non-linear tensor fitting to converge
- STRUCTURAL 1: structural image used as target for registration in DIFF_PREP (if it exists)
- OUTLIER MAP: for robust fitting only, the percentage of outlier data points removed before fitting
- (points removed/(total points-degrees of freedom))
- W_LINEAR: Westin linear measure
- W_SPEHRICAL: Westin spherical measure
- W_PLANAR: Westin planar measure
Tensor elements and eigenvalues are reported in 10-6mm2/s, or μm2/s
Naming convention of saved files
- _AM: Amplitude image
- _CS: Chi-squared map
- _DT: 4D file containing the 6 tensor elements
- _EG: Eigenvectors
- _EV: Eigenvalues
- _FA: Fractional anisotropy
- _LI: Lattice index
- _ME: mask eroded (by erosion factor)
- _MF: flow artifact mask - shows bad points which are masked automatically
- _MO: mask original - if the user selects an alternate mask, this image contains the original mask
- _MP: mask plain - mask before erosion factor is applied
- _MS: mask - either ME or MP depending on what the user sets. Default is ME
- _RA: Relative anisotropy
- _TR: Trace
- _VR: Volume ratio
- _WL: Westin linear
- _WP: Westin planar
- _WS: Westin spherical
The ROI FUNCTION menu contains a number of options, as shown in the figure and described below:

- IMAGE TYPE MENU: If you close the Image Type menu, this button will open a new Image Type menu
- EDIT OPTIONS: Contains options for the linefield and magnification of the displayed images.
- EDIT COLOR OPTIONS: Contains options for the display of the DEC maps.
- FILTER ROI OPTIONS: Allows the user to filter the ROIs for removal of unwanted regions, such as CSF.
- DRAW NEW ROI: Select the map on which you would like to draw the ROI (such as FA). Click this button to draw an ROI on your image. Then use the left click to draw, and right click to complete the ROI. Statistics of the selected maps will be output to the status report window. To save the ROI for display on other maps, or to output statistics, see the following options.
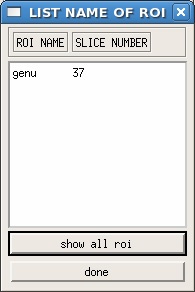
- ADD ROI TO LIST: To save your ROI for display on other maps, or statistics output, click this button. You will see a small window. Enter a name for your ROI. For example, genu as shown below.

- SHOW ROIs: To display your ROI, click this button. You will see a list of all ROIs that have been added. Click on the entry and it will display on the active map. If you click the show all roi button, it will display all of the ROIs sequentially in the order displayed in the list.

- LIST ROIs: If you click this button, it will list all of the "added" ROIs in the status report window.
- PROPAGATE TO SLICES: This function allows you to copy your ROI to another slice of your image. Simply select the ROI you would like to copy, then click on either "select slice to propagate" which will copy the ROI to the selected slice and add it to the ROI list, or "propagate to all slices" which will copy the ROI to all the slices of your image.
- SORT by NAME: This sorts your "added" ROIs by name.
- SORT by SLICE: This sorts your "added" ROIs by slice number.
- DELETE ROI: Use this to remove ROIs from your list.
- REPORT POINT: This will give you the coordinates of a single point in your image, simply by clicking on the desires location with the left mouse button.
- GET STATISTICS: This will save the statistics (from the selected maps) to a text file. It will create a directory in your procbase with _STAT appended to the end of the listfile name. In that directory, you will find two .DAT files containing the selected values at every voxel in your ROI.
- SAVE ROI: To save all "added" ROIs, click this button, then enter a name for your set of ROIs (with no extension).
- RESTORE OLD ROI: If you have previously saved an ROI file, you can reload it using this function. Simply navigate to the location of your save .roi file, and click restore.
- DONE: Click this when you are done looking at your maps and drawing ROIs.
