3.2.9.1 Define ROI
Regions of interest can be defined on any of the three orientation views of the triplanar viewer. In addition, multiple ROIs can be drawn and saved as a single region of interest, allowing for ROI definition that more closely matches a volume of interest.

Procedure for ROI definition
These images are explained in detail in the section describing the axial-only ROI utilities.
- Select the image type you would like to use for drawing your regions, and navigated to the desired slice of the brain for drawing
 Click on Define ROI, and a new menu will pop up with 3 options: UNDO, SAVE and DISCARD (figure at right)
- Hold down the left mouse button to draw continuously, or click with the left button to place points. Use the right button to close the ROI.
- Once you have closed the ROI, you can go to another view and/or another slice (using the sliders to the right of each view respectively), or do one of the following:
- Use UNDO if you wish to re-draw this ROI
- Use SAVE to save this single ROI as your region (proceed to step #6 after clicking SAVE)
- Use DISCARD if you wish to abandon ROI drawing
- Continue defining ROIs until you are happy with your region/volume of interest the do one of the following:
- Use SAVE to save your multiple ROIs as a single volume of interest
- Use DISCARD if you wish to delete all ROIs drawn in this volume of interest
- While UNDO and DISCARD appear to have similar behaviour, when drawing multiple ROIs, UNDO will only remove the most recently drawn region, while DISCARD will delete all
- When you click on SAVE, you will be asked to provide a name for your region.

- Type in the name of your ROI and hit the ENTER key on your keyboard. This should add your ROI to the list of regions. For example, we've named a sample region 'cc.'
- Click on the "Clear" button to clear the current region from the display and from the memory. To display that region again, double click on its name in the list.
- To define additional regions, follow steps 1–8. It is very important that you use the Clear button before defining additional ROIs. Any new regions drawn without clearing out the last region will be appended to the previous region!
Extracting Values from ROIs
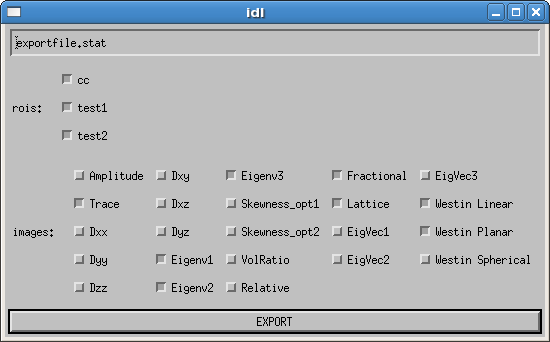
After all desired regions have been defined as described above, simple click on Extract values to create a text file with the voxel values contained in your ROIs. This will bring up a new menu that looks like:

- In the above figure, we have defined 3 ROIs: cc, test1 and test2. By default, all ROIs defined are selected. If you wish to only extract values for specific regions, deselect the ones you do not wish to keep by click on the radio buttons to their left.
- Values from all image types shown can be exported. Some common ones, such as Trace and Fractional Anisotropy (FA) are selected by default.
- Once values are selected as desired, click EXPORT. This will write a text file to your _proc directory.
- If you load the same dataset again, the triplanar viewer will locate previously drawn ROIs and automatically load them into the list. New ROIs can be defined at any time, and will simply be added to the list.
Additional Important Information
- The text file contains comma separated values. The value for each voxel within your ROI is reported. This text file can be easily imported into most spreadsheet and subsequently statiscal analysis software packages for computation of summary statistics.
- All ROIs are saved as binary nifti image files, with voxels inside the ROI=1 and outside=0. These can be loaded in any software which reads nifti images. For instance, these can potentially be used for defining seed points for tractography in software pacakges such as FSL and TrackVis.
- The nifti files and the list of regions are stored in a directory called "ROIs" which is created inside your data set's _proc directory.
- If you wish to permanently remove any ROIs, simply double click on them in the list, and then click on Delete Selected ROI.
