3.2.10.2 Edit Color Options
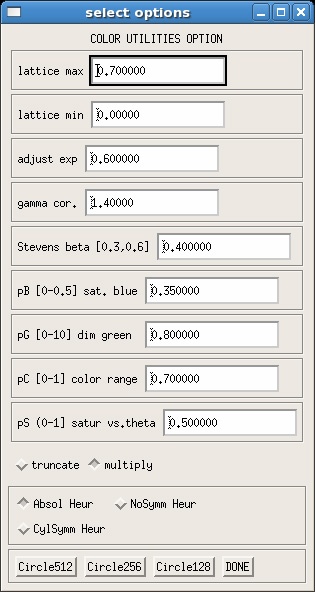
The options in this menu control the appearance of the directionally encoded color (DEC) maps by allowing the user to optimize the display of the DEC maps for a specific screen. These are heuristically determined parameters, as described in Pajevic and Pierpaoli1. Ideally, you should adjust the values below so that the visual perception of the color circle has a uniform distribution of the colors. An example is shown below.

- lattice max: The DEC maps are displayed filtered by the Lattice Index. This value determines the maximum lattice index used to filter the images. If you set this to a lower value, you will saturate high values but also help bring out low anisotropy features.
- lattice min: minimum lattice index value for filtering of DEC maps.
- adjust exp: This affects only have the images are viewed on your monitor. The default value is set to a generally good value, but you may wish to adjust this for better visualization, depending on your monitor.
- gamma cor.: Similar to adjust exp, this controls the gamma correction for your monitor.
- Stevens beta, pB, pG, pC, and pS: Are all heuristic parameters as proposed in the Pajevic and Pierpaoli Color Schemes paper1.
- truncate, multiply: Multiply is the default option. This will weight the DEC map by the lattice index. If you select truncate, the DEC map will no longer be weight, but will be of uniform intensity. This can be used if the user would like to view only a specific range of anisotropy values. Set the lattice max = max of your range of interest and lattice min = min of your range of interest, and then select the truncate radio button, and reload the DEC map.
- Radio buttons that control the type of color map, as defined Pajevic and Pierpaoli1. Select the map you wish to view, then click DONE. To display the new color map, click on the DEC button of the Image Type menu in order to refresh the displayed image.
- Absol Heur: Absolute value
- CylSymm Heur: Cylindrical symmetry
- NoSymm Heur: No symmetry
- Circle buttons: These buttons display the color circle of the selected color map type at different resolutions (512, 256, or 128).
- DONE: Click this when you are done setting color settings.
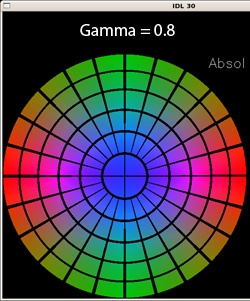
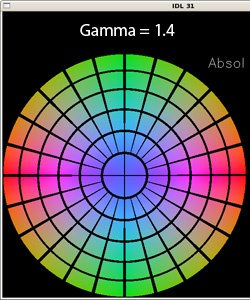
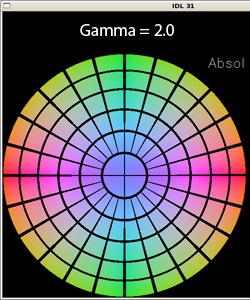
Example: Three different gamma correction values with the absolute value DEC map. On our screens, a gamma value of 0.8 shows very dark, with poor angular distribution of the colors; a large amount of blue and green colors are visible, with less red and yellow. On the other end, a gamma value of 2.0 shows faint colors, with more red and yellow visible, with less blue and green. A gamma value of 1.4 for our screens (and the default value for the program) shows the best range of colors.


References
- Pajevic, S. and Pierpaoli, C. (1999) Color schemes to represent the orientation of anisotropic tissues from diffusion tensor data: application to white matter fiber tract mapping in the human brain. Magn Reson Med. 42:526-540.
